Data Visualization, often called “Dataviz”, is the set of techniques that allow the visual transformation and the synthesis of raw data to make them speak.
.elementor-heading-title{padding:0;margin:0;line-height:1}.elementor-widget-heading .elementor-heading-title[class*=elementor-size-]>a{color:inherit;font-size:inherit;line-height:inherit}.elementor-widget-heading .elementor-heading-title.elementor-size-small{font-size:15px}.elementor-widget-heading .elementor-heading-title.elementor-size-medium{font-size:19px}.elementor-widget-heading .elementor-heading-title.elementor-size-large{font-size:29px}.elementor-widget-heading .elementor-heading-title.elementor-size-xl{font-size:39px}.elementor-widget-heading .elementor-heading-title.elementor-size-xxl{font-size:59px}
Where does the concept of Data Visualization come from?
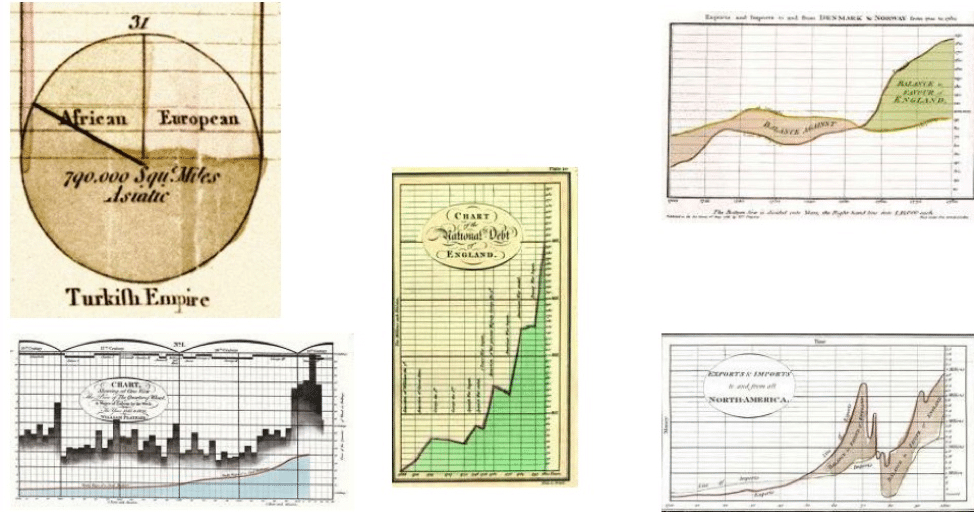
Dataviz is a process of transmitting information that goes back several centuries.
In the 18th century, the engineer and economist William Playfair invented the histogram, the pie chart, and the time series, 3 simple types of graphs still widely used today.
.elementor-widget-image{text-align:center}.elementor-widget-image a{display:inline-block}.elementor-widget-image a img[src$=”.svg”]{width:48px}.elementor-widget-image img{vertical-align:middle;display:inline-block}
1 – William Playfair (1759 – 1823), pioneer of dataviz
Today, Dataviz is present everywhere, whether it is in the latest Analysis report of your website or the most mainstream media. It is also a powerful communication tool that can be put to good use in Data Science.
Let’s imagine that you have just completed an exhaustive analysis of a database containing the purchases and characteristics of many consumers. During your analysis, you must have noticed a lot of useful information, for example, the impact of the promotion strategy decided by your company. You must have defined performance indicators to give credibility to your analysis. So you end up with a lot of figures that are difficult to understand for everyone.
How can you summarize your analysis in an intelligible and clear manner without using indigestible tables of figures?
This is where Dataviz comes in. Data visualization will offer you a set of techniques allowing the transformation of raw and often complex data into accessible visual representations to make them quickly understandable to the greatest number of people.
By using graphs such as pie charts or histograms you will be able to synthesize and organize your analysis.
Moreover, access to data becomes faster, and more relevant and makes the data sharing easier and use easier by different branches.
You will be able to tell the story of your analysis, using what we call storytelling. Better than illustrating, you need to unfold, using the tools offered by dataviz, the steps of your reasoning until the conclusion.
Python has emerged as the go-to language in recent years for exploring and analyzing data sets.
One of the advantages of Python is that you can use the same free and open-source language for many data science tasks such as data mining, statistical analysis, machine learning, and data visualization.
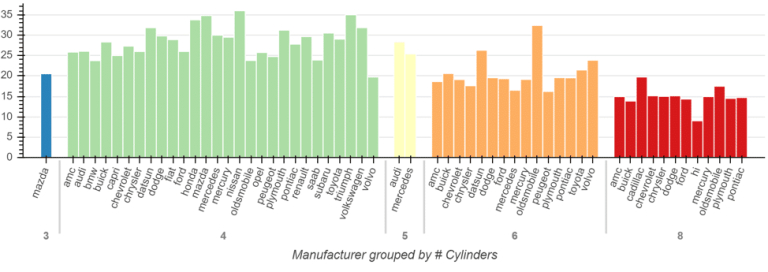
Matplotlib is the first Python library that allows you to generate and manage several types of graphs, in a fairly simple and orderly way.
It is also the most used in Data Science with Python, and the most common in Data Vizualization training.
2- Graphs realized with Matplotlib
Many other libraries, based on Matplotlib, have been created to modernize graphics and make their creation even simpler.
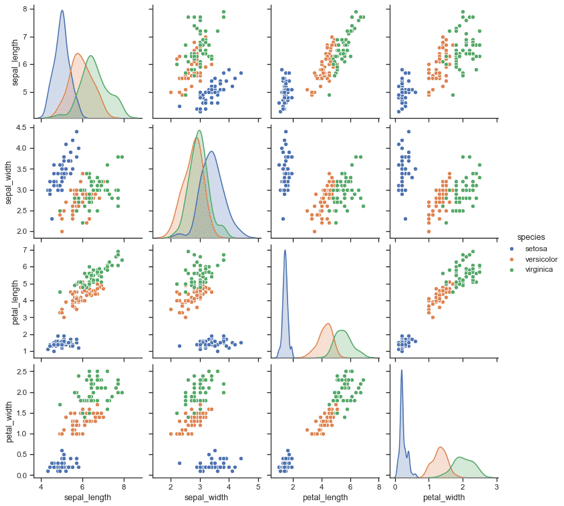
This is the case of Seaborn, very appreciated for its statistical graphics and its disconcerting simplicity.
This library is used in addition to Matplotlib. For the advanced management of the design of your graph, titles, frames, and axes, Matplotlib will be indispensable while Seaborn will be more appreciated for its aesthetics.
3- Seaborn chart
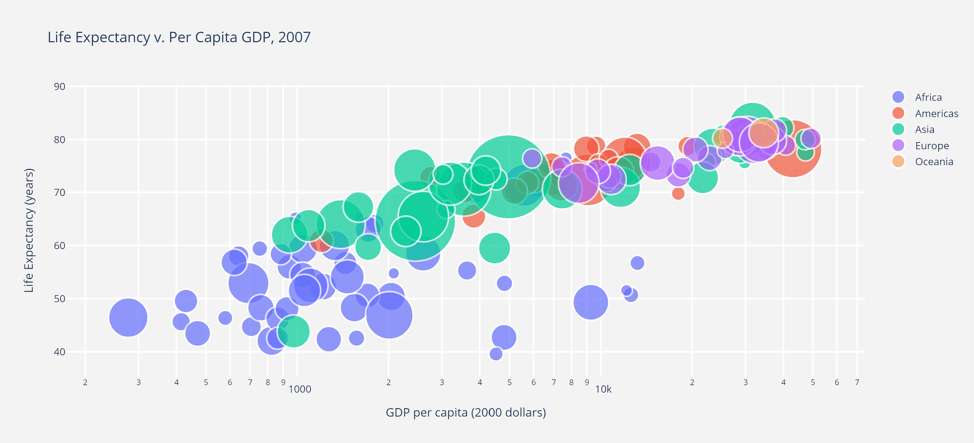
More recently, the appearance of libraries such as Plotly or Bokeh, make it possible to create high-level interactive graphics, which are easily integrated into a web page, without needing to master JavaScript.4- Bokeh graph
With specialized libraries such as Holoviz or Geoviews, you can also quickly create mapped dataviz, very popular with the media.
6- Holoviz chart
There are many other tools, such as Dash which allows you to create dashboards and web applications with your graphs.
All these packages have the advantage of being very well-documented and easy to use (provided that you have worked on your data beforehand). They will allow you to display and save good-level graphs synthesizing efficiently the information of your dataset according to the message you want to put across.
You will be able to display up to 4-5 pieces of information easily in the same graph, and with 2 lines of code, with some of Seaborn’s functions.
For a web application containing several interactive graphs, you will need a longer code, it’s up to you to define the investment that will suit you depending on the expected result.
Take your future into your own hands. Choose your desired start date, and begin your application by filling out the appointment form.
Bootcamp
Tuesday 8 September 2026
Analytics Engineer
Remote
English
Bootcamp
Tuesday 3 November 2026
Analytics Engineer
Remote
English
Upcoming starting dates
Take your future into your own hands. Choose your desired start date, and begin your application by filling out the appointment form.
No upcoming dates
THE TEaM
They won’t leave until you land your dream job and celebrate with you 🍾
Liora is more than a training. It’s a whole team walking forward with you, step by step, until you get hired. Mentors, coaches, instructors… all committed to your success.
Estelle
Career Associate
Vincent
Career Associate
Magali
Career Associate
Bilal
Career Associate
Kahina
Career Associate
THE SUPPORT
Support built for your success
Our structured support and expert training open real career opportunities in data, cyber, and tech.
Premium resources just for you
A private platform with exclusive insights on market shifts and career strategy.
A Slack space to log in, ask questions, and grow with fellow learners.
Stay updated with expert tips on trends, events, and career moves.
Individual career coaching, tailored for you
From day one, our Career Team supports you with personalized coaching. We help you:
Shape your career path around your goals and experience.
Find the right opportunities and fine-tune your job search strategy.
Get personalized advice to level up your job hunt.
High-impact career workshops
Our expert-led group sessions help you prepare for the job market: from polishing your CV and LinkedIn to nailing interviews, building a smart job search strategy, crafting your pitch, and building your network.
A strong network that opens doors
We connect you with recruiters through job fairs, speed-dating sessions, and curated industry events.
The impact of our support in numbers
52k€
Average gross salary of our alumni
Real proof that our programs lead to high-quality, high-paying jobs in data, tech, and AI.
9.53/10
Satisfaction for individual coaching
With 1000+ coachings delivered each year, our live support gives you direct access to industry experts to ask, unblock, and accelerate your job hunting process.
9.1/10
Satisfaction for group workshops
Hands-on sessions that help you improve your CV, LinkedIn, interview skills, and job search strategy.
71%
Employment rate
within 6 months of graduating a clear sign of how effective our training and career support really are.
70+
career-focused workshops every year
covering key topics like employability, networking, career transitions, and personal branding tailored to every learner.
4
recruitment fairs per year
Whether online or in person, these exclusive events create real connections between our talent and recruiters.
They benefited from our Career Support
Great Training Bootcamp! Thanks to the way Datascientest teaches and the constant support provided by the teachers, I was able to get the practical da…
James
I learned a lot in the program it is really an amazing platform to grow with your career and start with potential. I really felt helped and received a…
Rajini Sharma
I am really amazed by the human quality of the Hack A Boss team, Selene, Dmitry, Pablo and Daniel are amazing people who are willing to help and teach…
Simon Cariou
I recently finished my Bootcamp for Data Analyst and I am very happy with the knowledge I gained and experience it gave me. The modules were very clea…
Matea Mutz
I find this platform is the best because it's an intelligent way of learning in this era, just text content plus some needed short tutorial videos. al…
Ahmed
I am really amazed by the human quality of the Hack A Boss team, Selene, Dmitry, Pablo and Daniel are amazing people who are willing to help and teach…
Lautaro Martinez
Just finished training yesterday (3 + 2 days). Group interactivity was effective, the instructor was very responsive. His experience in business as co…
Stéphane Bourain
Finance Controller
I would like to share with you a great experience lived recently by following "Data Analyst Training". I have learnt lots of skills (Python, Data Anal…
Khalid
Very high-quality training. Thank you for the presentation. I strongly recommend this training provider. It covers nearly all the key aspects needed t…
Mohamed Haijoubi
Data Engineer
I completed a Data Engineer training program at DataScientest, and overall, the course is well-structured — a balanced mix of projects, theory, and …
Moustafa B
SRE Lead
Now certified and very satisfied with the Data Scientist training, I’ve decided to continue my journey with DataScientest by enrolling in the MLOps …
Alexandre L
An excellent training provider for Data-related careers. The courses are well-designed, and you’re quickly challenged through exams after each modul…
Rémy
The training offers a solid overview of various Machine Learning techniques, and access to a wealth of content — including coaching sessions, alumni…
Anonymous
The bootcamp program is really intensive, specially for a person who has no programming background, but the course is definitely worth it. It helped m…
Shiva
As part of my career transition, I pursued my DevOps training through a work-study program at DataScientest. I chose to follow both courses with DataS…
Nicolas Utter
Content Creator
Awesome education, awesome people.
Alexander P
I'm delighted to share my experience with this bootcamp! After completing my bachelor's degree, I was searching for a way to work with computers and d…
Dotun Olujide
A lot of things to learn and a lot of information! was an amazing experience.
Tiago R
I’d like to share my feedback following the high-quality training I completed on Microsoft Power BI, delivered by DataScientest. This experience was…
Anonymous
Excellent course with practical focus! Really enhanced my data science skills, directly applicable to my research. Highly recommend DataScientest for …
Lina Livdane
Overall impression is good. The course content is well-organized, thoroughly designed and challenging as well. In the end, I believe I am well-prepare…
Khoa Tran
I really enjoyed the course material and the fact that everything was remote. Well I haven’t finished the MLOps part yet. The data science part was …
Marius
Onboarding was smooth & lessons on your own & remote were particularly adequate to me
Clément Dué
Loved the format which was perfect for me – as a young parent. Additionally, I found the resources (platform) to be very good, and the instructors to …
Christian Müller
AI Scientist
I successfully completed my Data Analyst training last month and was very satisfied — within just six months, I was able to learn the key fundamenta…
Henry
Angelika Tabak
DataScientist.com is always interested in maintaining a good reputation and producing good graduates. But don’t be afraid, the instructors are very …
Baris Ersoy
PL/SQL Developer
I’m really glad I chose DataScientest. Balancing work, family, languages – and now data – learning is challenging, and their flexible format makes i…
Debora Ferreira
Probably the best Data & AI training course out there. Loved the structure, depth and hands-on approach of the Data Science & MLOps course. I …
Benjamin S.
Data Scientist
The content of the module undoubtedly covers the most important aspects of Machine Learning and MLOps. The final project allows you to put into practi…
Darwin Oca
As a seasoned software engineer with many years of experience, I was looking to refresh my IT skills and deepen my knowledge in data-related technolog…