.elementor-heading-title{padding:0;margin:0;line-height:1}.elementor-widget-heading .elementor-heading-title[class*=elementor-size-]>a{color:inherit;font-size:inherit;line-height:inherit}.elementor-widget-heading .elementor-heading-title.elementor-size-small{font-size:15px}.elementor-widget-heading .elementor-heading-title.elementor-size-medium{font-size:19px}.elementor-widget-heading .elementor-heading-title.elementor-size-large{font-size:29px}.elementor-widget-heading .elementor-heading-title.elementor-size-xl{font-size:39px}.elementor-widget-heading .elementor-heading-title.elementor-size-xxl{font-size:59px}
Main Features of D3.js
- Flexibility: Unlike other visualization libraries, D3.js does not impose predefined structures. You have full control over how your data is represented.
- High performance: By directly manipulating the DOM (Document Object Model) and utilizing the browser’s native capabilities, D3.js offers optimal performance for complex visualizations.
- Active community: With a vast community, there are numerous plugins, add-ons, and tutorials to help you get started.
Why Use D3.js?
If you want to create custom visualizations that exceed the ordinary, D3.js is the perfect tool for you. Here are several reasons why you should consider using it: .tg {border-collapse:collapse;border-spacing:0;}.tg td{border-color:black;border-style:solid;border-width:1px;font-family:Rubik, sans-serif;font-size:14px;
overflow:hidden;padding:10px 5px;word-break:normal;}
.tg th{border-color:black;border-style:solid;border-width:1px;font-family:Rubik, sans-serif;font-size:14px;
font-weight:normal;overflow:hidden;padding:10px 5px;word-break:normal;}
.tg .tg-br1o{background-color:#ffffff;font-family:Rubik, Helvetica, sans-serif !important;font-size:18px;text-align:left;
vertical-align:middle}
.tg .tg-fbhe{background-color:#c0c0c0;font-family:Rubik, Helvetica, sans-serif !important;font-size:18px;font-weight:bold;
text-align:left;vertical-align:middle}
.tg .tg-nkdd{background-color:#c0c0c0;text-align:center;vertical-align:middle}
 |
Flexibility and Customization | D3.js grants complete control to build any visualization based on your specific data. |
|---|---|---|
 |
Performance for Massive Data | This library is optimized to efficiently handle large datasets without sacrificing smooth performance. |
 |
Integration with Web Standards and Other Frameworks | D3.js is based on standard web technologies such as HTML, CSS, or SVG, making it easy to integrate into your current projects. It can also be used in conjunction with other frameworks like React, Angular, or Vue.js. |
 |
Interactivity | A standout feature of D3.js is its capability to generate highly interactive visuals that captivate users. |
 |
Ecosystem and Community | With a large community of developers and analysts, D3.js enjoys abundant support and resources. |
 |
Modularity | This allows you to utilize only the modules you require. It also enables the creation of reusable components from one project to another. |
 |
Real-Time | You can craft visualizations that update in real time, perfect for dashboards and monitoring applications. |
Getting Started with D3.js
Installation
To begin, you can include D3.js in your project using a CDN:
Or with npm:
npm install d3
Simple Example: A Bar Chart
The following code helps you create a simple bar chart:
Inspiring Examples of Visuals Created with D3.js
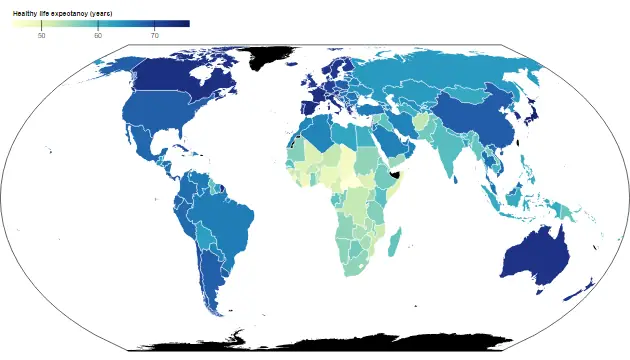
- Interactive Choropleth Map:
.elementor-widget-image{text-align:center}.elementor-widget-image a{display:inline-block}.elementor-widget-image a img[src$=”.svg”]{width:48px}.elementor-widget-image img{vertical-align:middle;display:inline-block}
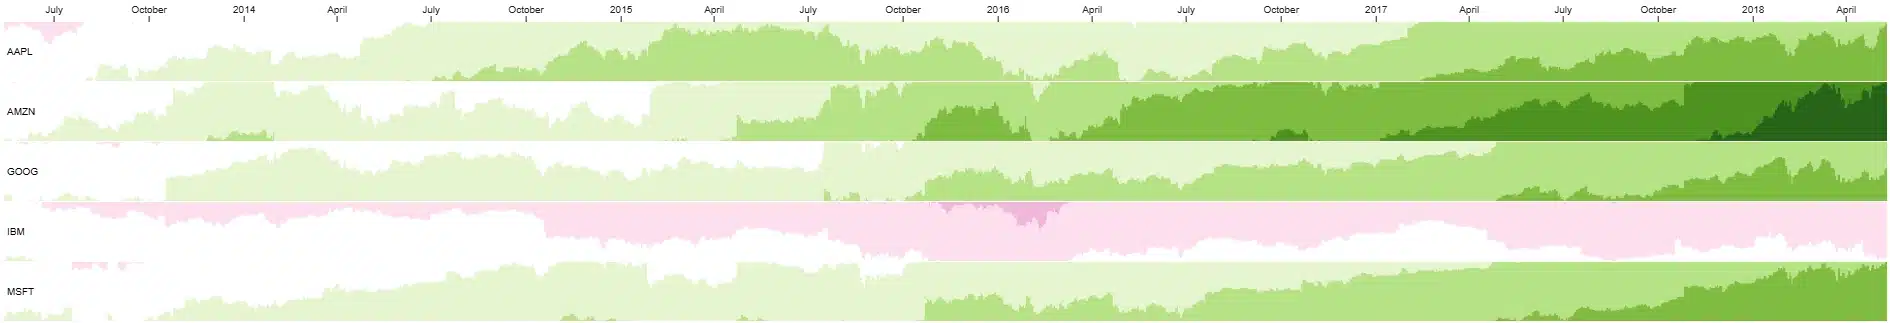
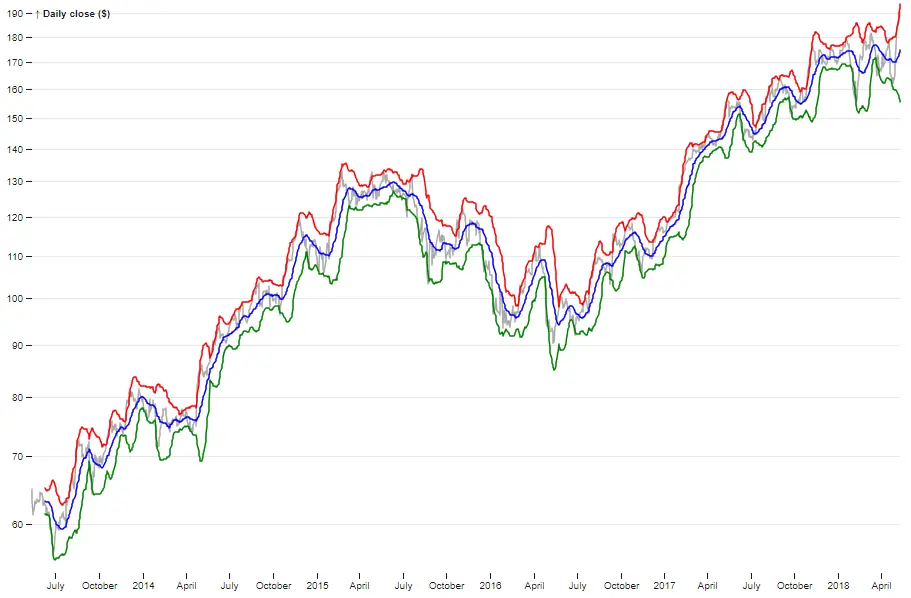
- Bollinger bands :
- Horizon charts :