
Anthropic announced today that its AI assistant Claude can now create interactive charts and diagrams directly in conversations, marking a major upgrade to the Claude 3.5 Sonnet model. The feature, available immediately to all users, enables real-time data visualizations using web technologies like HTML and SVG, transforming Claude from a text-only chatbot into a collaborative workspace that rivals offerings from OpenAI and Google.
The visualizations appear directly within conversations when Claude determines they would enhance understanding or when users specifically request them, according to The Verge. Unlike static images, these graphics support full interactivity, such as clicking on elements in a periodic table to access detailed information about each component.
The system leverages HTML, CSS, JavaScript, and SVG to create platform-independent outputs that users can modify through follow-up requests, The Verge reported. This approach differs from Claude’s existing Artifacts feature, which displays content in a separate side panel, by integrating visuals directly into the conversational flow.
Enterprise Integration and Market Impact
Anthropic has made the visualization capabilities available through its API, Amazon Bedrock, and Google Cloud’s Vertex AI, enabling developers to incorporate the feature into custom applications. Potential uses span from automated business intelligence dashboards to system architecture diagrams and interactive educational materials.
The dual-feature approach combines inline visuals for immediate context with the Artifacts workspace for persistent, editable creations like code snippets or website designs. This positions Claude as a comprehensive work tool rather than a simple chatbot, directly challenging OpenAI’s ChatGPT and Google’s Gemini in the enterprise market.
Safety measures for the Claude 3.5 Sonnet model include evaluations by the UK’s Artificial Intelligence Safety Institute, achieving an ASL-2 safety level, Anthropic stated. The company maintains its policy of not training models on user data without explicit permission, though specific mechanisms for citing data sources within generated charts were not detailed in the announcement.
Technical Capabilities
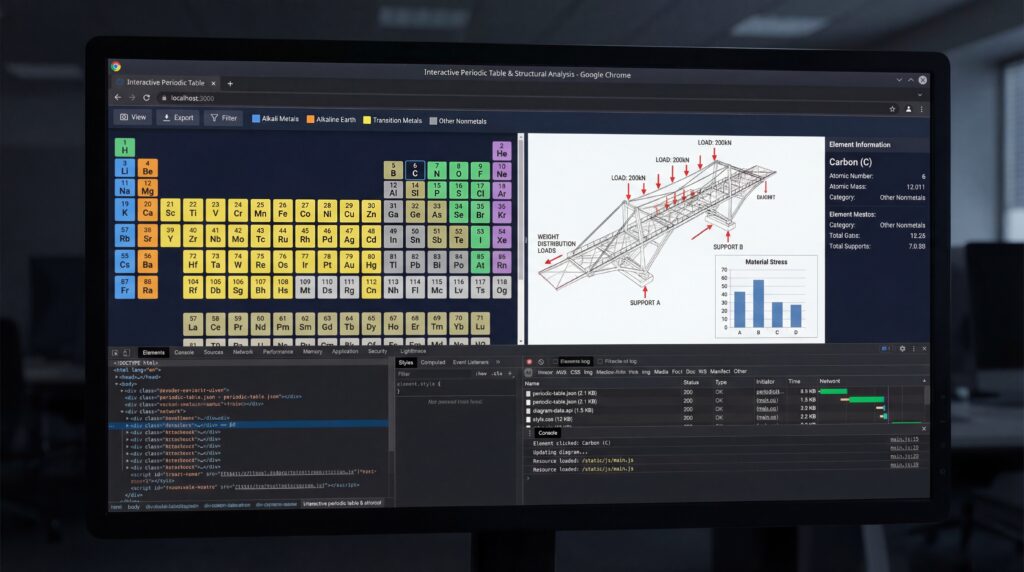
Examples demonstrated by Anthropic include an interactive periodic table and architectural diagrams showing weight distribution through buildings. Users retain control over the output, with the ability to request iterative changes to any visualization Claude produces.
The feature’s default availability to all users ensures rapid adoption and feedback collection, while the use of standard web technologies allows for rich, interactive outputs across different platforms and devices. This technical foundation enables Claude to generate everything from simple bar charts to complex, clickable system diagrams without requiring specialized software or plugins.
Sources
- theverge.com
- anthropic.com/news